Utilization rate measures what percentage of an employee’s available working time is spent on productive work. Across North America, it is the primary metric agencies, consultancies, and service businesses use to assess team capacity and identify where time is going untracked. OfficePunch’s activity monitoring data gives HR managers and team leads a foundation for calculating utilization without relying on manual self-reporting. This guide walks through the formula, a worked numeric example, and the most common calculation errors.
Key takeaways
- The utilization rate formula is: (Billable or Productive Hours ÷ Available Hours) × 100.
- A team member working 40 available hours per week who spends 32 of those on productive work has a utilization rate of 80%.
- Available hours are tracked hours during which the employee is working — not theoretical schedule hours or total calendar hours.
- The most common calculation error is using scheduled hours (for example, 40 hours per week) as the denominator instead of actual tracked hours.
- OfficePunch’s activity logs track active versus idle time on Windows desktops, giving HR teams the factual denominator without relying on self-reported hours.
Before you start
Utilization rate calculations are only as accurate as the underlying time data. Before running any utilization calculation, you need two things: a reliable record of available working time, and a consistent definition of what counts as productive or billable work in your context.
Many teams skip the second step and end up comparing apples to oranges — one manager counting email as productive, another excluding it. Define productive time before you calculate, and apply the definition consistently.
What you need
- A record of each employee’s actual working hours during the period (daily or weekly session logs)
- A defined list of what activities count as productive or billable in your organisation
- A consistent time period (a week, a month, a quarter)
- A calculator or spreadsheet for the arithmetic
Safety and prerequisites
Utilization rate works as a performance signal when the underlying time data is accurate. If your time records are self-reported weekly timesheets, retroactive entry, or estimates, the utilization figure is an estimate too. The metric is only as reliable as the input. Automated session-level tracking — such as OfficePunch’s activity log — provides a more accurate base than timesheet-based data.
Also note: utilization rate is a capacity metric, not a quality metric. A 95% utilization rate means time is occupied — it does not mean the work is excellent. Treat it as a signal worth investigating, not a verdict.

Step-by-step
Utilization rate: worked example with numbers.
Step 1: Identify available hours
Available hours are the hours your employee was working and available to perform productive tasks during the period. In a standard 40-hour week, this is often 40 hours — but deduct any leave, statutory holidays, or untracked absence.
Example: Maya worked Monday to Friday this week. She took two hours of personal leave on Wednesday afternoon. Her available hours: 40 − 2 = 38 hours.
Verify this number against your time records before proceeding. If you are using OfficePunch, the session log shows the exact start and end of each PC session, giving you a documented available-hours figure for each day. The how to calculate employee utilization rate post shows how to extract these figures from Office Punch’s reports.
Step 2: Identify productive or billable hours
From Maya’s 38 available hours, determine how many were spent on productive work. If you have detailed activity tracking, use the app and website usage data to identify productive versus non-productive time. If you are using a broader definition, apply it consistently.
Example: Of Maya’s 38 tracked hours, 30 were spent on client-facing work, project delivery, and internal meetings. The remaining 8 hours were spent on email, administrative tasks, and a half-day team training session that your organisation excludes from the productive count.
Maya’s productive hours: 30 hours.
If it does not work first time
If your productive hours figure seems implausibly high or low, check whether your definition of productive time is applied consistently. The most common issue is managers including administrative time in the productive count for some employees and excluding it for others.
Most common cause
Inconsistent definitions. “Productive” means something different in every organisation, and teams that have never written down a definition tend to find that each manager applies a different one. Standardise the definition before comparing utilization figures across teams.
Stop here if you see this
If your available hours figure is higher than the employee’s contracted hours, stop. You have either included overtime in the denominator or your tracking data covers more time than the employee was scheduled to work. Clarify whether you are measuring contracted utilization or total utilization before proceeding.
Step 3: Apply the formula
(Productive Hours ÷ Available Hours) × 100 = Utilization Rate
Maya’s calculation: (30 ÷ 38) × 100 = 78.9%
Round to one decimal place for reporting. A utilization rate of 78.9% means Maya spent approximately 79% of her available working time on productive tasks this week.
Step 4: Verify and interpret
Check the result against your organisation’s target utilization range and against the same employee’s rate in prior periods. A single week’s figure is a data point, not a trend. Look for pattern changes rather than reacting to individual readings. Document your interpretation alongside the figure so that the same data means the same thing when a different manager reviews it next quarter.
Interpretation example: If Maya’s utilization rate has been consistently 75–80% for three months and drops to 58% in a given week, that is worth examining. If it has been variable week to week between 65% and 85%, a single 58% week is within normal variation.
For agency time tracking contexts where utilization feeds into capacity planning, weekly figures are most useful when aggregated into monthly rolling averages. A four-week rolling average smooths the week-to-week variation that comes from training days, onboarding, and uneven project distribution.
When DIY stops being sensible
Manual utilization calculations from self-reported timesheets work for teams of up to three or four people. Beyond that, the data collection overhead and the inconsistency risk from multiple people defining productive time differently makes manual calculation unreliable.
For teams of five or more, automated activity tracking gives you a consistent, factual base for utilization calculations. OfficePunch’s Windows desktop monitoring captures active versus idle time automatically — no employee action required — and produces session-level reports that can feed directly into a utilization calculation.
The practical difference is significant. A self-reported timesheet captures what an employee believes they worked, rounded to the nearest quarter hour and completed days or weeks after the fact. An automated session log captures when the PC was active, which application was in the foreground, and whether the session was idle — at the minute level, recorded in real time. The denominator in your utilization formula is far more reliable when it comes from a machine log than from memory.
The agency time tracking page covers how Office Punch’s activity data works as a utilization input for service businesses and agencies that need to track team capacity across multiple projects.
What a North America professional does differently
Agencies and consultancies across North America that run utilization tracking at scale use two practices that most small businesses skip.
First, they separate capacity utilization from billable utilization. Capacity utilization measures how much of the employee’s time is actively occupied. Billable utilization measures how much of it is charged to a client. The gap between the two reveals internal overhead — business development, internal meetings, training — and helps management teams make informed decisions about headcount.
Second, they track utilization at the team level and the individual level. Individual figures identify capacity problems early. Team-level figures avoid penalising individuals for project distribution decisions that management controls.
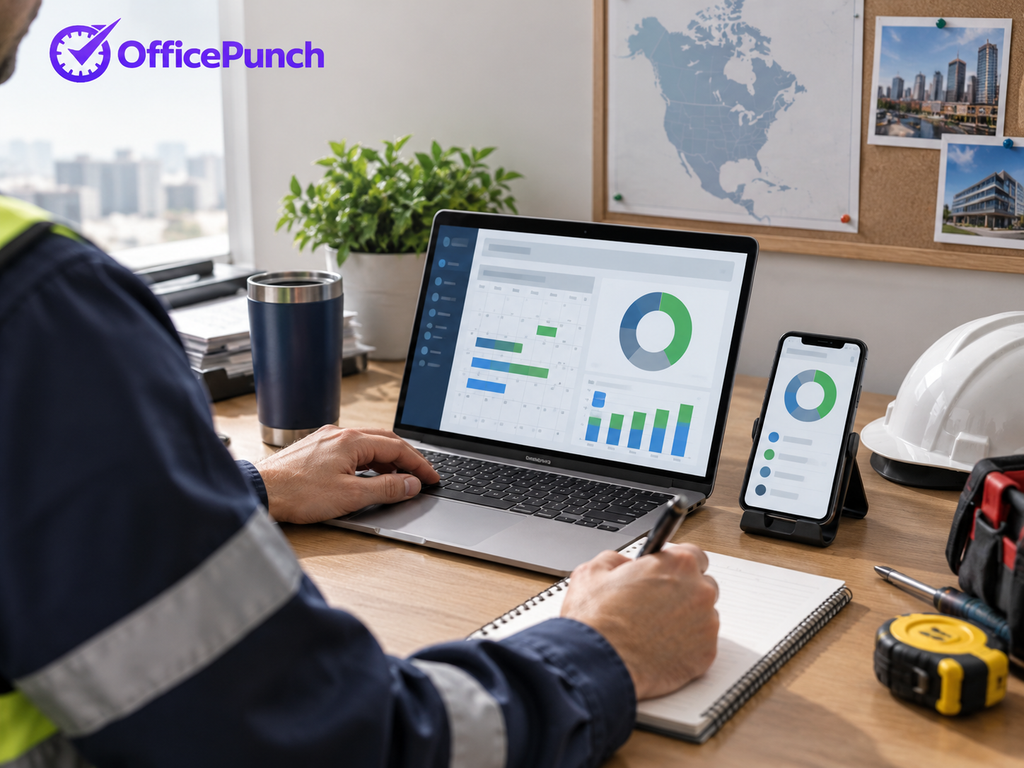
Office Punch’s active versus idle time data provides the raw capacity utilization input. The platform tracks what was on screen and how long each session was active, giving North American HR and operations teams the factual base they need without requiring employees to self-report their time in a separate system.
Frequently asked questions
What is a good employee utilization rate?
A commonly cited target for North American service businesses is 70–80% for individual contributors and 65–75% for managers. Utilization above 90% for sustained periods is typically a warning sign — it indicates a team member has no capacity for development, internal work, or unexpected demand. Rates below 60% for multiple consecutive weeks suggest under-assignment or tracking gaps that need investigation.
Why does my utilization rate calculation give a result over 100%?
A utilization rate over 100% means the productive hours figure exceeds the available hours figure. The most likely cause is that overtime or additional hours have been included in the productive count but not in the available hours denominator. Check whether your available hours figure includes all time the employee worked, including any hours beyond their contracted schedule.
Can OfficePunch calculate utilization rate automatically?
OfficePunch tracks active versus idle time and produces session-level activity reports for Windows desktop users. It does not produce an automatic utilization percentage — that calculation requires your organisation’s definition of productive time applied to the raw activity data. OfficePunch gives you the factual time inputs; the utilization calculation is built from those inputs in a spreadsheet or reporting tool.
About OfficePunch
OfficePunch is a Canadian-built Windows desktop monitoring platform serving businesses across North America. The platform automatically tracks active and idle time throughout each PC session, captures app and website usage, and produces session-level reports that HR teams and operations managers use as inputs for capacity and utilization analysis. Office Punch’s flat per-organization pricing makes utilization tracking cost-effective for teams that cannot justify per-user monitoring software at scale.
Service area
OfficePunch serves businesses across North America, including agencies, consultancies, and service businesses in Toronto, Vancouver, Calgary, Edmonton, Ottawa, Montreal, and major US markets. The platform supports distributed teams with employees in multiple provinces, providing a centralised attendance and activity record that operations teams can use for capacity planning without relying on self-reported time data.
Next step
To start tracking the active and idle time data that feeds utilization calculations, visit agency time tracking for the full feature overview and to activate your free plan for up to five users.