Key Takeaways
- Employee utilization rate measures productive work as a percentage of available hours.
- The formula is: Productive Hours ÷ Available Hours × 100.
- An ideal utilization rate falls between 70% and 80%.
- Rates above 90% risk employee burnout.
- Rates below 60% suggest underutilization or idle capacity.
- Credit utilization ratio uses the same percentage logic — but measures available credit, not work hours.
- Monitoring utilization regularly supports better workforce decisions.
The employee utilization rate is one of the most important workforce metrics available. It tells you how much of your team’s available time is spent on productive work. Too low, and resources are being wasted. Too high, and burnout becomes a risk. This guide explains how to calculate utilization. It covers what a good rate looks like. It also shows how to use this data for informed decisions.
What Is Employee Utilization Rate?
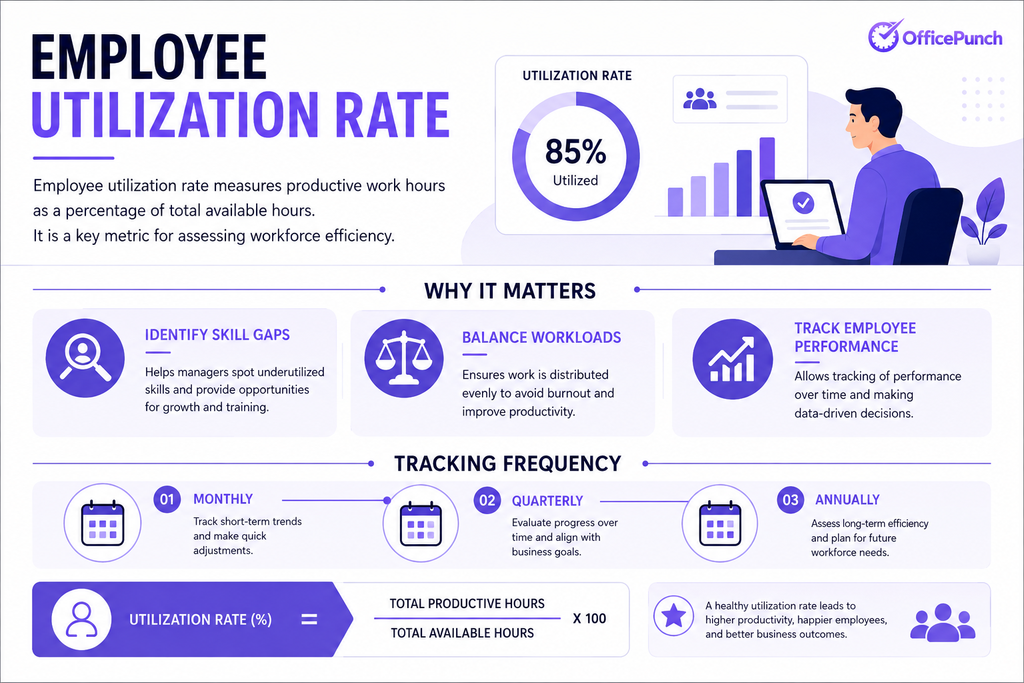
Employee utilization rate measures productive work hours as a percentage of total available hours. It is a key metric for assessing workforce efficiency. It helps managers identify skill gaps, balance workloads, and track employee performance over time. Utilization rates can be tracked monthly, quarterly, or annually.
Why It Matters
A low utilization rate signals idle capacity. A high rate signals potential burnout. Both extremes cost your business money. Monitoring utilization provides valuable insights into how your team actually spends time.
The Utilization Rate Formula
The utilization rate formula is straightforward:
Utilization Rate = (Productive Hours ÷ Available Hours) × 100
- Productive hours = time spent on productive tasks and productive work.
- Available hours = total scheduled work hours in the period.
This calculation gives a percentage. It is expressed as a percentage of actual time used versus time available.
How to Calculate Employee Utilization Rate
Follow these steps to calculate utilization for any employee or team.
- Determine available hours. For example, 40 hours per week.
- Track productive hours. Exclude internal meetings, administrative tasks, and non billable work.
- Apply the formula. Divide productive hours by available hours.
- Multiply by 100. This gives the utilization rate percentage.
Example
An employee works 40 available hours per week. They spend 30 hours on productive tasks. The remaining 10 hours cover non billable tasks and administrative work.
30 ÷ 40 × 100 = 75% utilization rate
This falls within the ideal range. The same calculation applies across teams, departments, and roles.
What Is a Good Utilization Rate?
An ideal utilization rate is typically between 70% and 80%. This allows room for breaks, overhead costs, and operational flexibility.
| Role Type | Ideal Utilization Rate |
|---|---|
| Production staff | 70% – 90% |
| Account management | 60% – 80% |
| Knowledge workers | 70% – 80% |
Utilization rates above 90% can indicate employee burnout. A utilization rate below 60% is generally considered poor. A 100% utilization rate may indicate employee burnout and is unsustainable long-term.
Utilization Rate by Industry
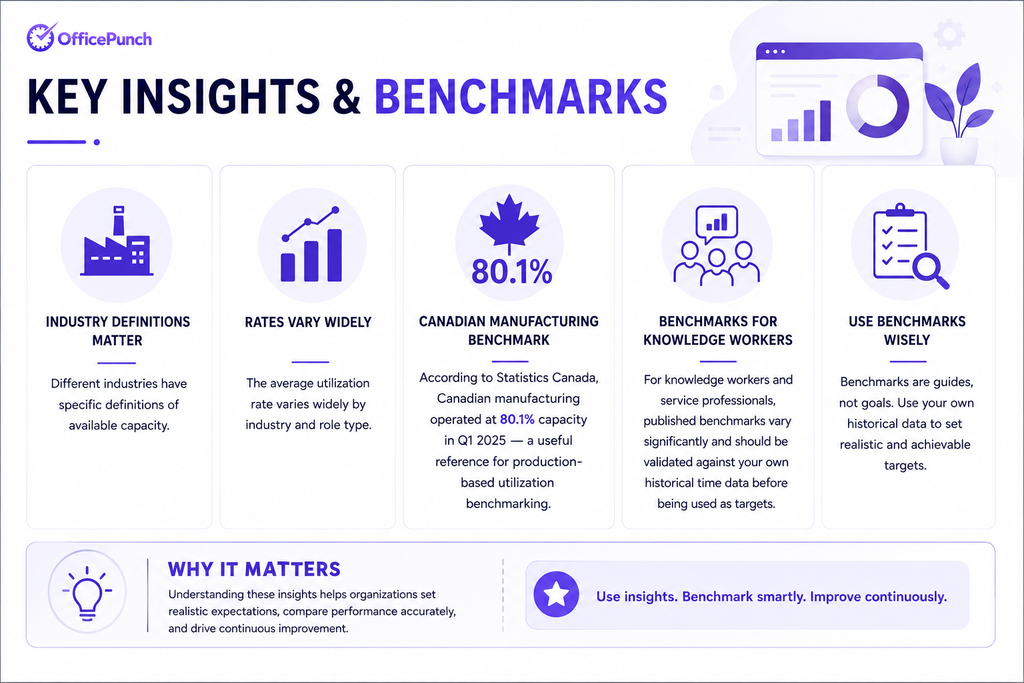
Different industries have specific definitions of available capacity. The average utilization rate varies widely by industry and role type. According to Statistics Canada, Canadian manufacturing operated at 80.1% capacity in Q1 2025 — a useful reference for production-based utilization benchmarking. For knowledge workers and service professionals, published benchmarks vary significantly and should be validated against your own historical time data before being used as targets.
High utilization can improve profit margin by spreading fixed costs across more output.
What Is Capacity Utilization Rate?
The capacity utilization rate measures actual output against maximum potential output. It is widely used in manufacturing and production sectors. According to Statistics Canada, Canadian industries operated at 80.1% capacity in Q1 2025. The capacity utilization rate equals actual output divided by estimated potential output. It is expressed as a percentage. Optimal utilization allows room for maintenance and operational flexibility.
High vs Low Utilization
Signs of High Utilization
- Employees consistently work overtime hours.
- Quality of output begins to decline.
- Increased errors in productive tasks.
- High staff turnover or absenteeism.
Overutilization leads to employee burnout and decreased productivity. It also raises overhead costs through errors and rework.
Signs of Low Utilization
- Employees spend excessive time on non billable hours.
- Too many internal meetings fill the workday.
- Workers report feeling underutilized.
- Actual time logged falls far short of available hours.
A lower utilization rate indicates idle capacity. It can signal poor scheduling or skill mismatches.
How to Improve Your Utilization Rate
Use these steps to move toward an ideal utilization rate.
Identify Skill Gaps
Low utilization often reflects skill gaps. When employees lack training for available tasks, they default to non billable work. Identifying skill gaps allows you to redirect time toward productive work.
Reduce Non Billable Time
Non billable tasks like excessive internal meetings drain capacity. Audit how non billable hours are spent. Eliminate redundant administrative tasks where possible.
Track Time Accurately
Accurate data is essential. Without reliable tracking, utilization calculations are unreliable. Use automated time tracking to capture actual time with precision.
Monitor on a Regular Basis
Review utilization data monthly. Compare actual time worked against available hours. Identify trends early. Make informed decisions before utilization drifts too far in either direction.
Employee Utilization vs Credit Utilization Ratio
Note: The word “utilization” applies in two very different contexts. The following explains how the same calculation logic applies to credit — a useful comparison for understanding the formula.
Both concepts use the same percentage logic. The difference lies in what is being measured.
What Is Credit Utilization?
The Same Calculation, Different Context
Why Office Punch Supports Utilization Tracking
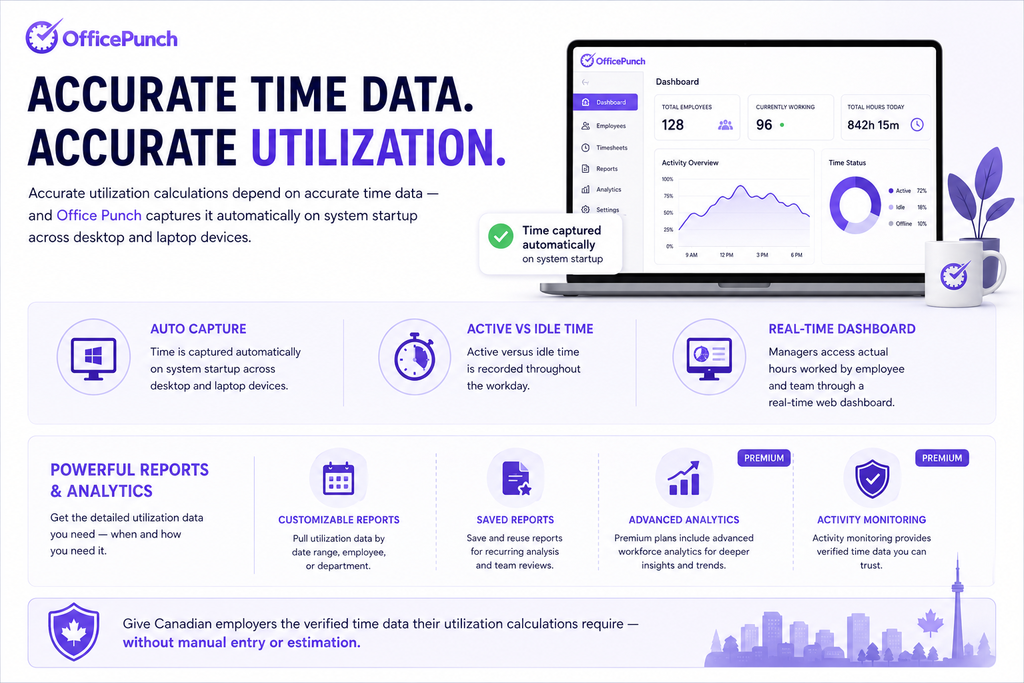
Accurate utilization calculations depend on accurate time data — and Office Punch captures it automatically on system startup across desktop and laptop devices. Active versus idle time is recorded throughout the workday. Managers access actual hours worked by employee and team through a real-time web dashboard.
Customizable reports and saved reports let HR teams pull utilization data by date range, employee, or department. Premium plans add advanced workforce analytics and activity monitoring that give Canadian employers the verified time data their utilization calculations require — without manual entry or estimation.
Want accurate utilization data for your team? Book a demo with Office Punch and see how automated time tracking gives Canadian businesses the workforce data they need to improve productivity and performance.
Frequently Asked Questions
What is employee utilization rate and how is it calculated?
Employee utilization rate measures the percentage of available work hours spent on productive tasks. Calculate it using this formula: Productive Hours ÷ Available Hours × 100. An ideal utilization rate is between 70% and 80%. Rates below 60% suggest underutilization. Rates above 90% risk employee burnout. Track this metric monthly to support informed decisions about staffing and workload distribution.
What is a good capacity utilization rate?
A good capacity utilization rate falls between 70% and 85% for most industries. According to Statistics Canada, Canadian industries operated at 80.1% capacity in Q1 2025. For production staff, the ideal utilization rate is 70% to 90%. Rates above 90% risk strain on resources. Optimal utilization leaves room for maintenance, overhead costs, and operational flexibility.
What is billable utilization and how is it measured?
Billable utilization measures the percentage of available hours spent on billable tasks versus total hours available. It is a key metric for professional services firms. The ideal billable utilization rate ranges from 70% to 80%. Non billable hours — including administrative tasks and internal meetings — reduce this rate. Tracking billable versus non billable work gives valuable insights into actual time and profit margin.
How do I calculate utilization and track actual time on an annual basis?
To calculate utilization on an annual basis, total all productive hours worked across the year. Divide by total available hours for the same period. Multiply by 100. Example: 1,500 productive hours ÷ 2,000 available hours × 100 = 75% utilization rate. This same calculation applies to individual employees, teams, or entire departments to identify trends over time.
Disclaimer
This content provides general guidance on workforce productivity metrics for Canadian employers. Industry benchmarks referenced are sourced from publicly available research and Statistics Canada data. This is not financial or legal advice. Consult a qualified Canadian HR professional or financial advisor for advice specific to your organization.
For credit-related guidance, visit the Financial Consumer Agency of Canada at canada.ca.